Antarctica Cruise Weather Forecasts: How Captains And You Can Read Them
 By Oleg G.
Antarctic weather can change quickly, and the forecast shapes your voyage more than any brochure. Here is what expedition teams look at, what is and is not published about forecast reliability, and what it means for your landings.
Quick answer: Operators do not publish a reliability horizon for Antarctic forecasts. Captains and expedition leaders re-check them every four to six hours, keep Plan A, B and C options for every day, and switch landing sites for wind, swell or ice. Passengers can follow along with free tools like Windy and the US National Ice Center charts.
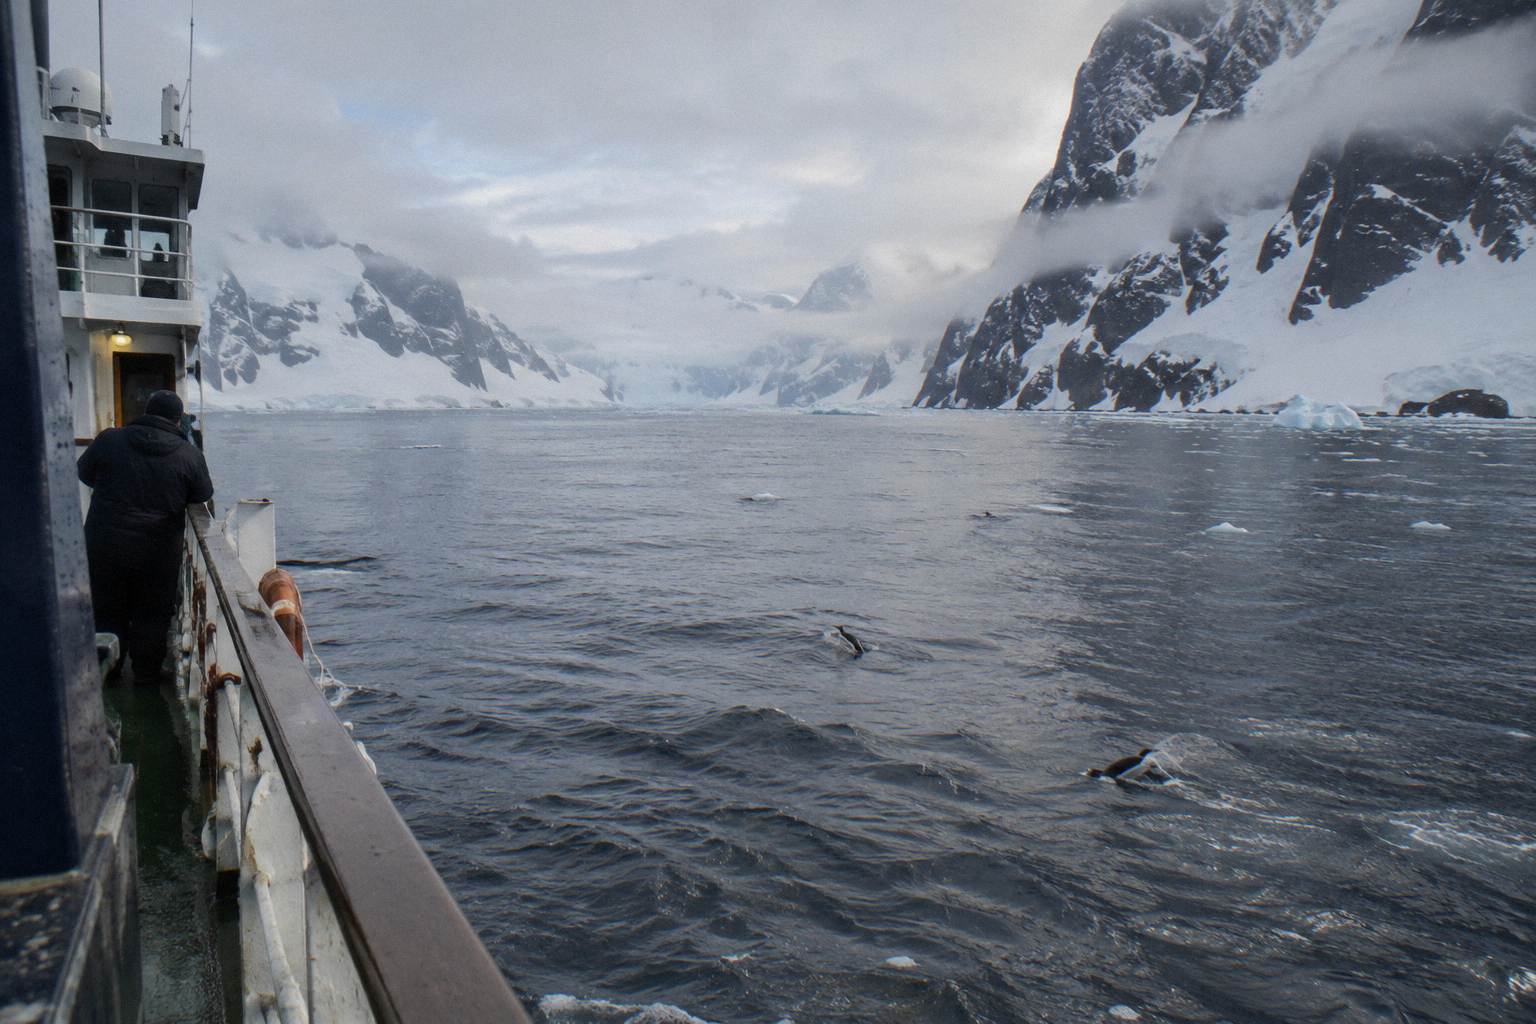
In Antarctica the forecast can rewrite your itinerary daily, and expedition teams hold Plan A, B and C options for each day. The weather window is short, roughly October to April, and within it the difference between a calm Drake Passage and a rough one, or between two landings and none, is decided by systems you can actually watch yourself. This guide covers the tools the professionals use, what is known about forecast reliability, how itineraries bend when conditions turn, and what a passenger can sensibly do with a forecast before and during a cruise.
How Far Ahead Can You Trust An Antarctic Weather Forecast?
No operator or official source we found publishes how many days ahead an Antarctic forecast can be trusted. Expedition leaders work around the uncertainty by holding Plan A, Plan B and Plan C options for every day of the voyage and re-checking conditions every four to six hours with the captain, so a forecast never has to be perfect, it only has to be right for tomorrow morning.
That cadence, checking forecasts every four to six hours and briefing guests nightly, comes from expedition-planning practice described by polar operators and guides, and it shows how short the planning horizon is in practice. Nobody in Antarctica plans a landing ten days out. They plan options, then commit the night before or the morning of. The Antarctic Peninsula adds its own complications: katabatic winds, sudden strong downslope gusts off the ice sheet that can appear without warning and stop a Zodiac operation even on a day that looked calm on the synoptic chart.
For you as a passenger, the practical takeaway is about when to start watching. Forecasts sharpen as departure approaches, so the final days before sailing are when watching is worthwhile. Once you are aboard, the nightly briefing is your real forecast, because the expedition team plans with the captain and translates the outlook into plain decisions about tomorrow.
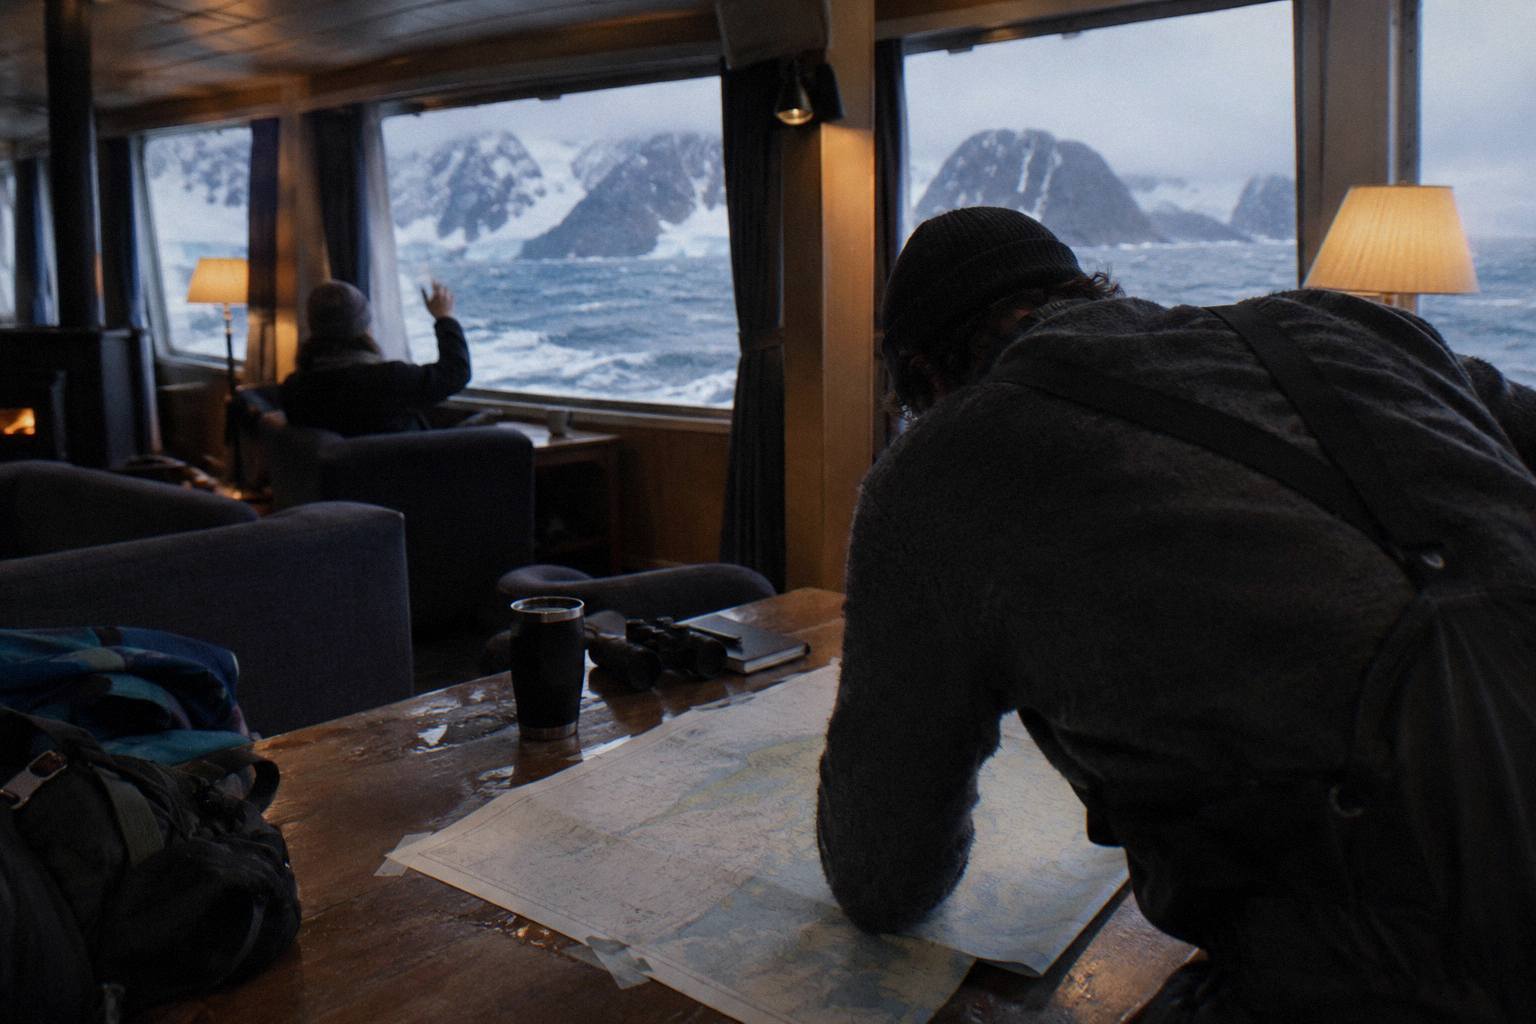
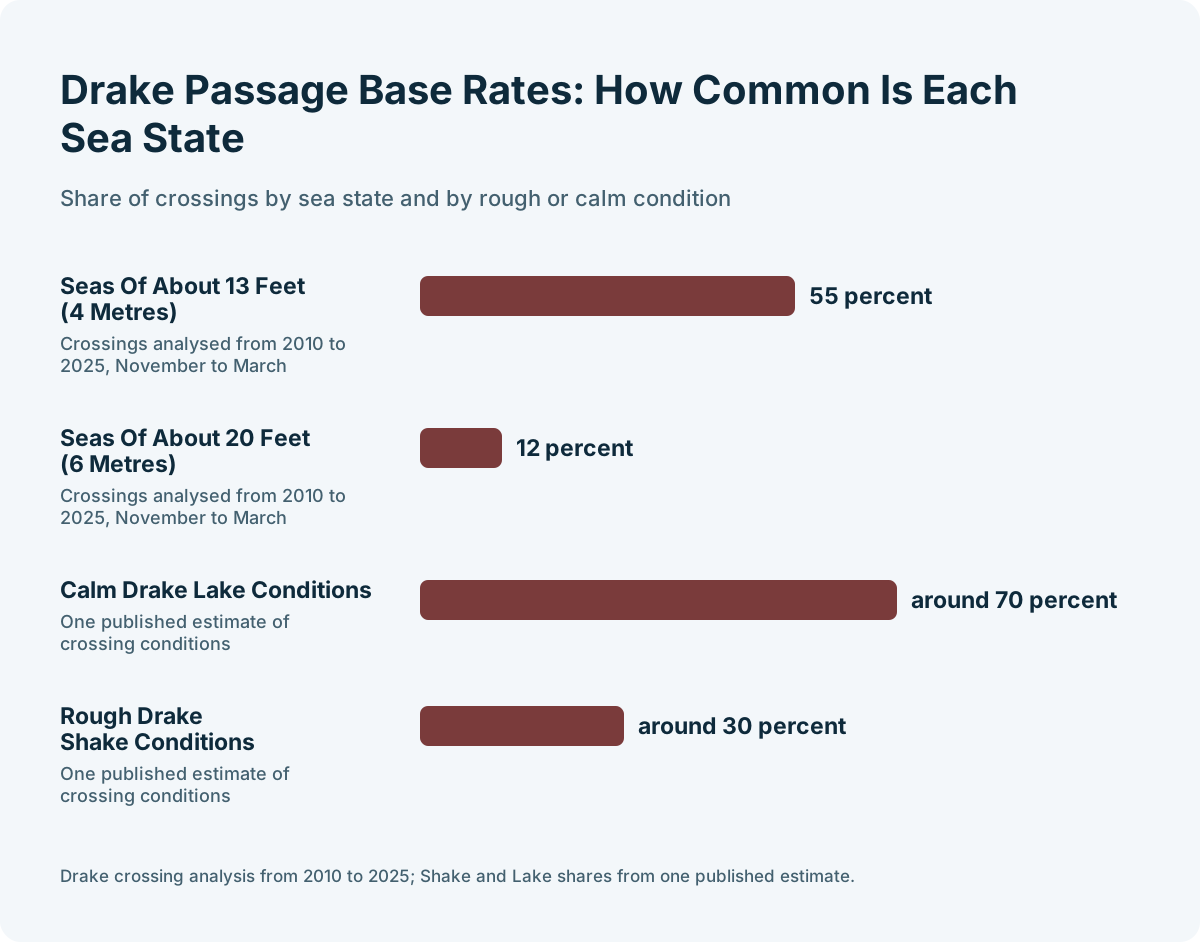
This is also why the question "will the weather be good in February?" has no honest answer at the level of an individual day. What does have an answer is the seasonal pattern. Analysis of Drake Passage crossings from 2010 to 2025 found that 55 percent of November to March crossings met seas of about 13 feet (4 metres), and 12 percent met seas of about 20 feet (6 metres). Those are the base rates; the forecast tells you which side of them your particular crossing falls on.
| Planning window | How much you can trust the forecast | What it is useful for |
|---|---|---|
| 3+ months out | Not a forecast at all | Seasonal patterns only: ice, daylight, wildlife timing |
| 2-3 weeks out | Not stated | Packing, buffer-night decisions, gateway flights |
| 5-7 days out | Not stated | Rough Drake expectation, fly-cruise delay awareness |
| 2-3 days out | Not stated | Final pre-sailing check |
| Day of | Re-checked every four to six hours by the team | Landing go or no-go, Zodiac operations |
If you are still choosing which month to travel, the seasonal weather patterns matter far more than any forecast, and our guide to the best time to visit Antarctica breaks those down month by month.
Which Forecast Tools Do Captains And Expedition Teams Use?
Expedition teams work from synoptic charts, spot forecasts, ice charts and their own observation. Passengers can access part of the same picture for free, including the Windy app, which expedition leaders use to show guests synoptic charts and spot forecasts at the nightly briefing.
The expedition leader's job is to translate the forecast into landing decisions, and according to expedition-planning guides, leaders maintain those Plan A, B and C options for each day and adjust for wind, swell at the gangway, beach waves, how sheltered a site is, and the experience of the Zodiac drivers. Quark Expeditions' own environmental documentation states the operator has no fixed maximum wind speed for Zodiac operations: the decision is made case by case, because a sheltered site may be workable in winds that would close an exposed one.
For ice, the professional source is government ice services. The US National Ice Center publishes weekly Antarctic regional synopses and daily and weekly ice charts showing concentration and stage of development, and these are the planning inputs for Weddell Sea and marginal ice zones, available publicly on its Antarctic charts page. A passenger who wants to understand why a captain changed route can look at the same type of ice chart.
For the traveller watching from home, the stack is simpler but real:
| Tool | What it shows | Who it is for |
|---|---|---|
| Windy app | Wind, pressure, swell, precipitation, layered models | Passengers and expedition leaders alike |
| US National Ice Center charts | Sea ice concentration and development | Route planning, Weddell Sea interest |
| Synoptic pressure charts | The systems driving wind and swell | Understanding the big picture |
| Ship's nightly briefing | Tomorrow's actual plan | Everyone aboard |
| Operator voyage updates | Pre-cruise outlook and notices | Booked passengers |
The Windy app deserves special mention because it is not a passenger hack, it is genuinely part of the briefing culture. Expedition leaders use it to show guests the forecast and explain why Plan B replaced Plan A, which turns a disappointing change into an understandable one. If you install it before departure and learn to read the pressure map, the nightly briefing becomes a conversation instead of an announcement.
One caution: free consumer forecasts are model outputs, and models handle the Antarctic Peninsula's terrain and katabatic winds imperfectly. Treat them as context for the professionals' decisions, never as a basis for second-guessing a Zodiac cancellation from the comfort of the lounge.
How Do Expedition Leaders Adapt Itineraries When The Forecast Turns?
Itineraries in Antarctica are written in pencil. When wind, swell or ice rule out a landing, the team shifts to a sheltered alternative, swaps a landing for a Zodiac cruise, or reorders the whole week, and operator terms commonly treat weather and ice as force majeure. The forecast does not just inform the plan, it is the plan.
The mechanics are consistent across the industry. One vessel visits a landing site at a time under IAATO rules, a maximum of 100 passengers may be ashore from a vessel at any one time unless site guidance requires fewer, and guides work at a ratio of at least one per twenty visitors, per the general visitor guidelines adopted under the Antarctic Treaty system. That coordination means a weather-driven change is not just about safety, it is also about slotting into a different site at a time no other ship is using it.
The 2026-27 season has already produced a textbook example. In November 2026, HX Expeditions cancelled an Antarctica sailing outright because of a multi-day storm forecast with winds above 50 knots and swells of 30 to 40 feet, rerouting the ship to the Falklands instead.
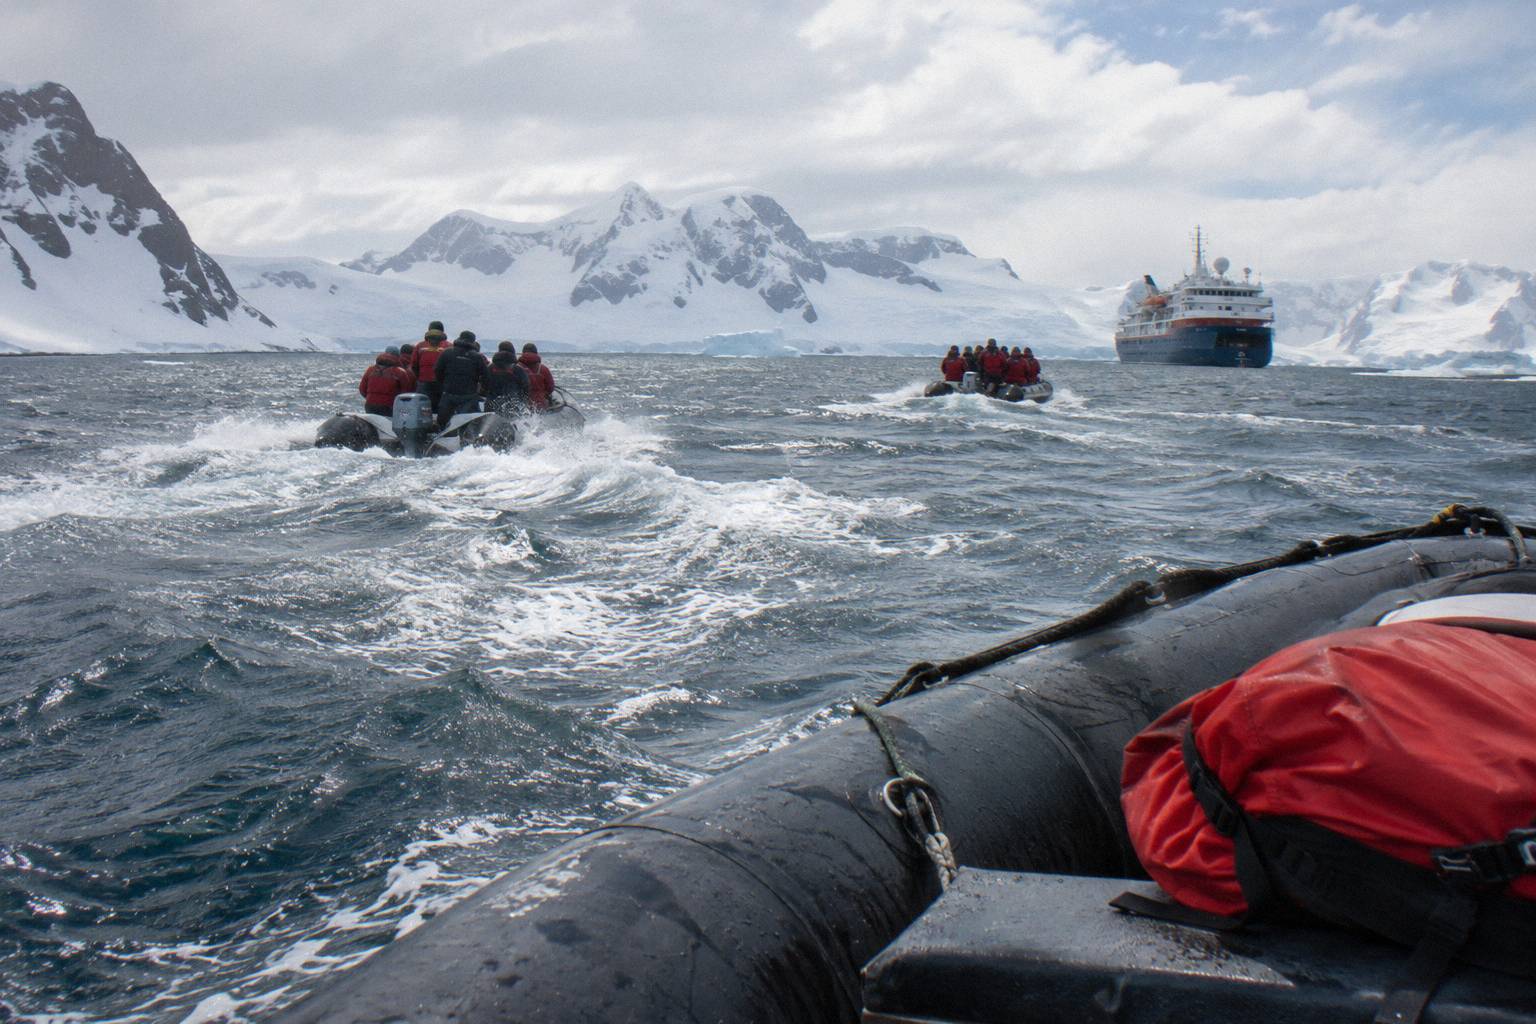
Adaptation is not always a loss. Expedition leaders switch landing sites or activities for wind, swell or ice, so a closed exposed site can mean a sheltered one or a Zodiac cruise instead. Ships with more landing options per day, meaning more Zodiacs and more flexible space, can absorb a bad forecast better than ships with fewer.
This is where ship choice quietly interacts with weather. A vessel like Hondius, Oceanwide Expeditions' 170-guest Polar Class 6 ship sailing 11, 13 and 19-day voyages from Ushuaia from $7,800 per person, operates the classic small-ship model: sheltered indoor Zodiac boarding and the same Plan A, B and C approach. The operator's Basecamp voyages bundle activities like camping and kayaking that give the expedition team extra cards to play when the forecast reshuffles the schedule.
Compare that flexibility across the three ships most readers of this guide are weighing:
| Ship | Class | Passengers | Ice class | From, per person | Voyage length | Departs from |
|---|---|---|---|---|---|---|
| HondiusOceanwide Expeditions | Small-Ship Budget | 170 | Polar Class 6 | from $7,800 | 11 to 19 days | Ushuaia |
| Magellan ExplorerAntarctica21 | Fly-Cruise | 96 (88 in Antarctica) | LR PC6 | from $13,795 | 8 days | Punta Arenas (fly) to King George Island |
| UltramarineQuark Expeditions | Upscale Expedition | 199 | 1A+, PC6 | from $12,236 | 12 to 14 days | Buenos Aires, Ushuaia |
Magellan Explorer, the Antarctica21 fly-cruise ship, has the tightest weather coupling of the three: its whole model depends on the charter flight to King George Island going on schedule, so the forecast matters to its guests in a way it does not for a Ushuaia departure. Ultramarine, Quark's 199-guest ship with two helicopters and 20 Zodiacs, has the most hardware of the three to deploy when landings close, though helicopter operations are themselves weather-limited. If this trade-off is the part of the decision you are stuck on, a free consultation on ship choice will walk through it with you, at no cost and with no obligation.
What Does A Drake Passage Forecast Actually Tell You?
A Drake forecast tells you the likely sea state for your two-day crossing, not a verdict on your voyage. Crossings run about 18 to 24 hours in good conditions and stretch to 36 to 48 hours in rougher seas, according to Quark Expeditions' own guidance, and the forecast's real job is telling you which of those you are facing, so you can prepare rather than worry.
The base rates are worth knowing before you ever open a forecast app. Of Drake Passage crossings analysed from 2010 to 2025 across the November to March season, 55 percent encountered seas around 13 feet (4 metres) and 12 percent encountered seas around 20 feet (6 metres). One published estimate puts rough "Drake Shake" conditions at around 30 percent of crossings and the calmer "Drake Lake" at around 70 percent. Everything else covered here is indexed on Cruises In Antarctica.
| Forecast picture | Likely crossing experience | What to do about it |
|---|---|---|
| Low pressure far south, light winds | Shorter, calmer crossing | Enjoy the seabirds |
| Moderate following winds | Average crossing, some motion | Standard seasickness precautions |
| Deep low tracking across the passage | Longer, rougher crossing | Medication early, cabin time, trust the stabilizers |
| Storm system parked on the route | Possible delay or reroute | Listen to the captain, expect schedule shifts |
Newer expedition ships are built for exactly this. Zero-speed stabilizers, some 50 percent larger than standard, work while the ship is stationary as well as underway, and X-BOW hull designs soften the ride into head seas. None of that removes a gale, but it changes what a gale feels like from a cabin, and the forecast tells you when to be grateful for the engineering.
The serious tail of Drake weather is rare but real. On 29 November 2022 the Viking Polaris was struck by a breaking wave south-east of Cape Horn; one passenger died and eight were injured when windows shattered. For a fuller treatment of rough conditions and what they mean for safety, see our guide to severe weather on an Antarctica cruise, and for the crossing itself, how the Drake Passage crossing works.
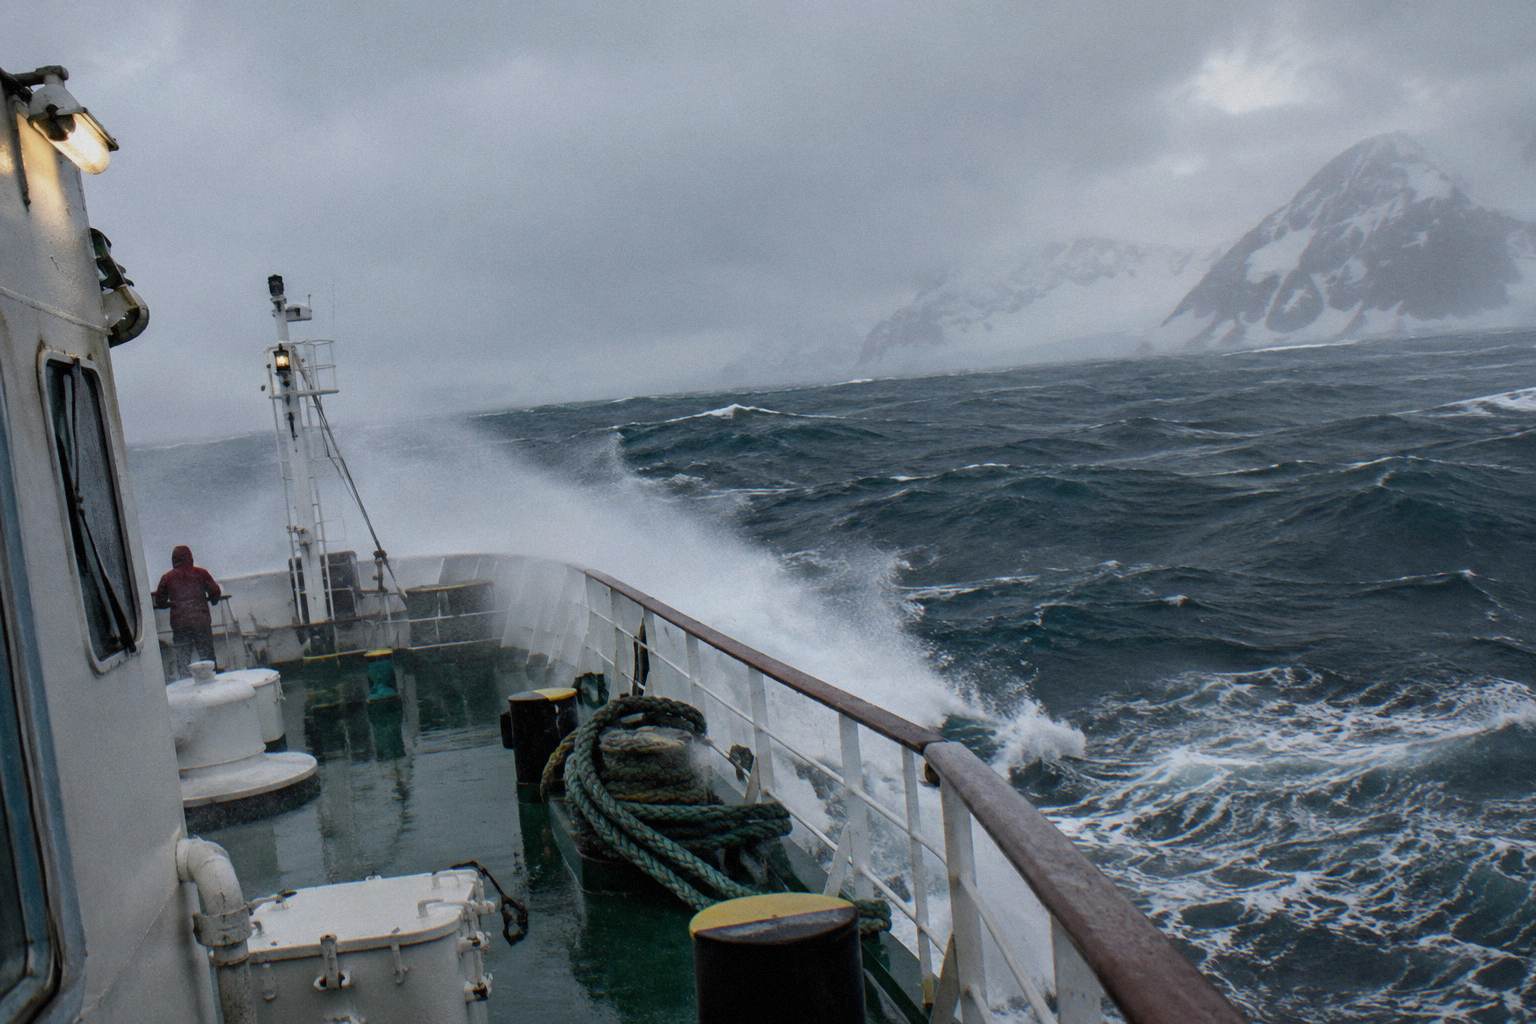
Practically, start watching the Drake forecast in the days before embarkation and check it daily. If you are prone to motion sickness, the forecast helps you time whatever remedy your doctor recommends. If the outlook is genuinely stormy, the right response is not cancellation anxiety but realistic expectations: a rough 48 hours, a ship that handles it, and a reward on the other side.
Fly-Cruise Weather: Fog At King George Island
Fly-cruise passengers swap two days of open ocean for a two-hour charter flight, and the forecast that matters most is the one for a gravel airstrip on King George Island, where fog, low cloud and wind cause the delays. Antarctica21's own flight data through April 2025 shows that of 346 flights, 264 left on the scheduled day, 26 actually left early, 40 were delayed one day, 13 by two days and 3 by three days.
That is roughly a three in four chance of leaving on schedule, and 40 of the other 82 flights losing a single day. Silversea reports that about 80 percent of its fly-cruises depart on schedule, with delays of one to three days handled by the operator with hotel stays and meals in the gateway city and adjustments to the time spent in Antarctica. Both figures say the same thing: the fly-cruise weather risk is real but bounded, and operators plan for it rather than pretending it does not exist.
This makes the forecast genuinely different for fly-cruise guests. Before departure you are watching Punta Arenas and King George Island visibility and wind, not the Drake sea state. Once aboard, your weather exposure looks like everyone else's, with one addition: the return flight window.
The seasonal layer matters here too. Early season, November, brings more sea ice and some landing sites can remain snowed in or ice-blocked, while late season, February and March, brings the least ice and the best odds for pushing south toward the Antarctic Circle, conditions permitting. Neither is a forecast, but both set the stage the forecast plays out on.
Sea Ice Forecasts And Route Planning
Sea ice, not weather in the ordinary sense, is the other force that rewrites Antarctic itineraries, and it is forecast separately. Ice is most extensive in November, restricting some routes and landing sites; it recedes through summer, and by February conditions are typically at their most open, which is why Antarctic Circle attempts cluster late in the season and why they are always described as ice-dependent.
The Antarctic Sound and the Weddell Sea side of the Peninsula are the classic examples: pack ice can shut the sound in November to a ship that could pass in February. Captains do not guess at this. They work from ice charts, the same US National Ice Center synopses and concentration charts described above, and combine them with real-time observation from the bridge and from the expedition team's scouting. The US National Ice Center publishes weekly regional synopses covering the Weddell Sea and marginal ice zones, and daily and weekly charts that show exactly where the ice edge sits.
For travellers, ice planning shows up in three ways. First, itinerary descriptions: any voyage promising the Weddell Sea, the Antarctic Circle or a specific far-south landing will carry ice-dependent wording, and the honest operators make that wording prominent. Second, season choice: if a deep-south route is the reason you are going, February gives the best odds. Third, expectations: an ice chart showing a closed route is not a failure of the operator, it is the continent being the continent.
| Season stage | Typical ice picture | What it means for your route |
|---|---|---|
| November | Most extensive ice, fresh snow on land | Pristine landings, some sites inaccessible |
| December | Ice receding, coast opening | More sites reachable, longer daylight |
| January | Near seasonal minimum on the Peninsula | Ice opening up; busiest month for ships |
| February | Least ice of the season | Best odds for Circle crossings and far-south routes |
| March | Ice retreating further but variable | Whale focus, late-season flexibility |
What Can A Passenger Usefully Do With A Forecast?
Realistically: install Windy, learn to read the pressure chart, watch the Drake outlook in the days before embarkation, and then hand the rest over to the people with routing data and 24-hour bridge watch. The most useful forecast skill a passenger can have is not prediction, it is understanding, because it turns every itinerary change from a grievance into a decision you can follow in real time.
Here is the practical sequence. A month out, ignore the forecast and confirm the things the forecast will eventually threaten: buffer nights in the gateway city, flexible inbound flights, and insurance that covers delay. In the final week, check the Drake or the fly-cruise gateway daily, and use the latest outlook to set medication timing, packing order and expectations. Aboard, attend the nightly briefing, watch how the team presents the Plan A/B/C structure, and use Windy to see the same chart they are showing.
There is also a planning-level use of weather knowledge that happens before any forecast exists, and it is the one with the highest payoff. Choosing a shoulder-season departure in November or March rather than the December to January peak changes your odds of both quieter landings and lower fares, at the cost of more ice or more receding-season variability respectively. Choosing a ship with many Zodiacs and a flexible activity program changes how much a bad forecast day costs you. These are forecast-adjacent decisions, and they are the ones where a conversation about your weather tolerance with a vetted expedition-cruise agency partner is worth having before you commit, free and without obligation.
What you should not do with a forecast is treat it as a booking instrument. Cancelling a voyage because a chart looks bad two weeks out is acting on noise. Trusting that a storm will pass because your app says so is acting on a model you cannot verify. The professionals hold the middle ground: they watch everything, commit to nothing early, and communicate constantly. Your job is to be a well-informed passenger of their decisions, and the forecast tools make that genuinely possible.
Common Questions About Antarctic Cruise Weather Forecasts
How far ahead is an Antarctica weather forecast reliable?
No operator publishes a fixed reliability horizon. Expedition teams re-check forecasts every four to six hours with the captain and hold Plan A, B and C options for every day, committing to each landing only shortly before it happens.
What forecast app do expedition teams in Antarctica use?
The Windy app is commonly used by expedition leaders to show guests synoptic charts and spot forecasts at nightly briefings. The bridge uses professional marine weather routing on top of that, plus ice charts from services such as the US National Ice Center.
Can the forecast cancel my Antarctica landings?
Yes. Wind, swell at the gangway, beach waves and site exposure all factor into the go or no-go call, and Quark's environmental documentation states there is no fixed wind threshold: each operation is judged case by case. The team substitutes sheltered sites, Zodiac cruises or other activities rather than simply losing the day.
Does the forecast matter more for a fly-cruise?
It matters differently. Antarctica21 flight data through April 2025 shows 264 of 346 charter flights left on the scheduled day, 40 were delayed one day, 13 by two days and 3 by three days, and Silversea reports about 80 percent of its fly-cruises depart on schedule. Fog, low cloud and wind at King George Island are the main risks rather than sea state.
Should I watch the Drake Passage forecast before my cruise?
Yes, in the days before you sail, when the outlook is most current and most useful for seasickness planning and expectations. Crossings run about 18 to 24 hours in good conditions and 36 to 48 hours in rougher seas, according to Quark Expeditions.
Can sea ice change my itinerary even with a good weather forecast?
Yes. Ice is forecast separately from weather, and it is most extensive in November, restricting some routes, while February typically offers the most open conditions. Weddell Sea and Antarctic Circle routes are always described as ice-dependent for exactly this reason.
More Weather, Cancellations And Terms
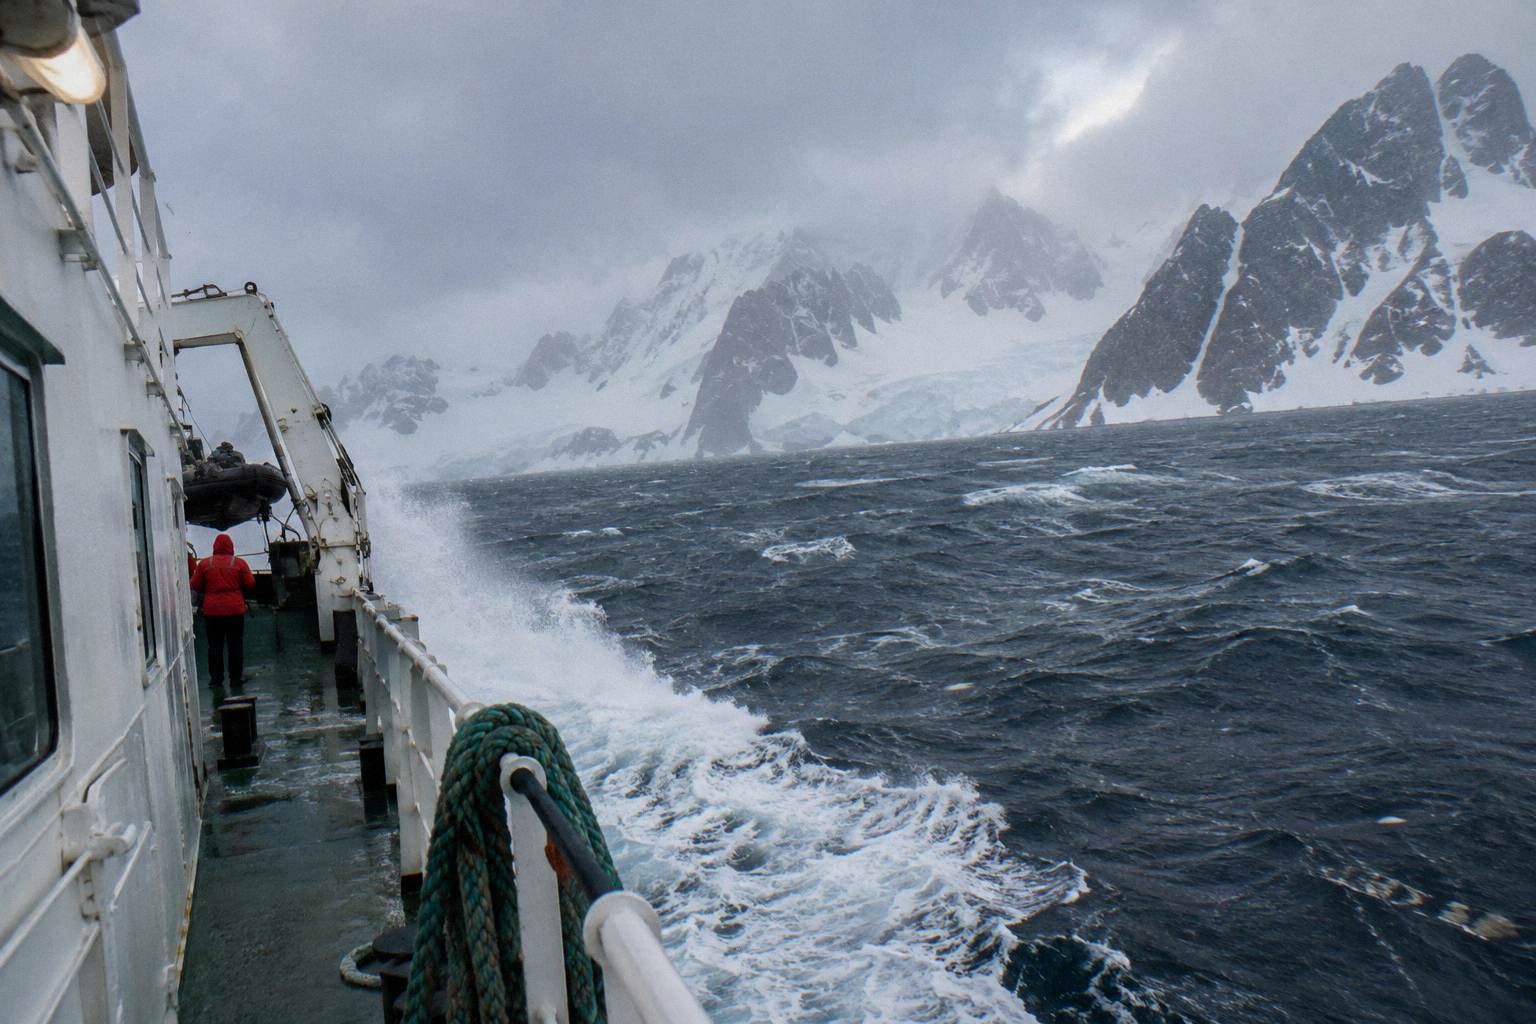 Severe WeatherStorms, delayed landings, cancelled sailings and what the crew does about it.Read the guide
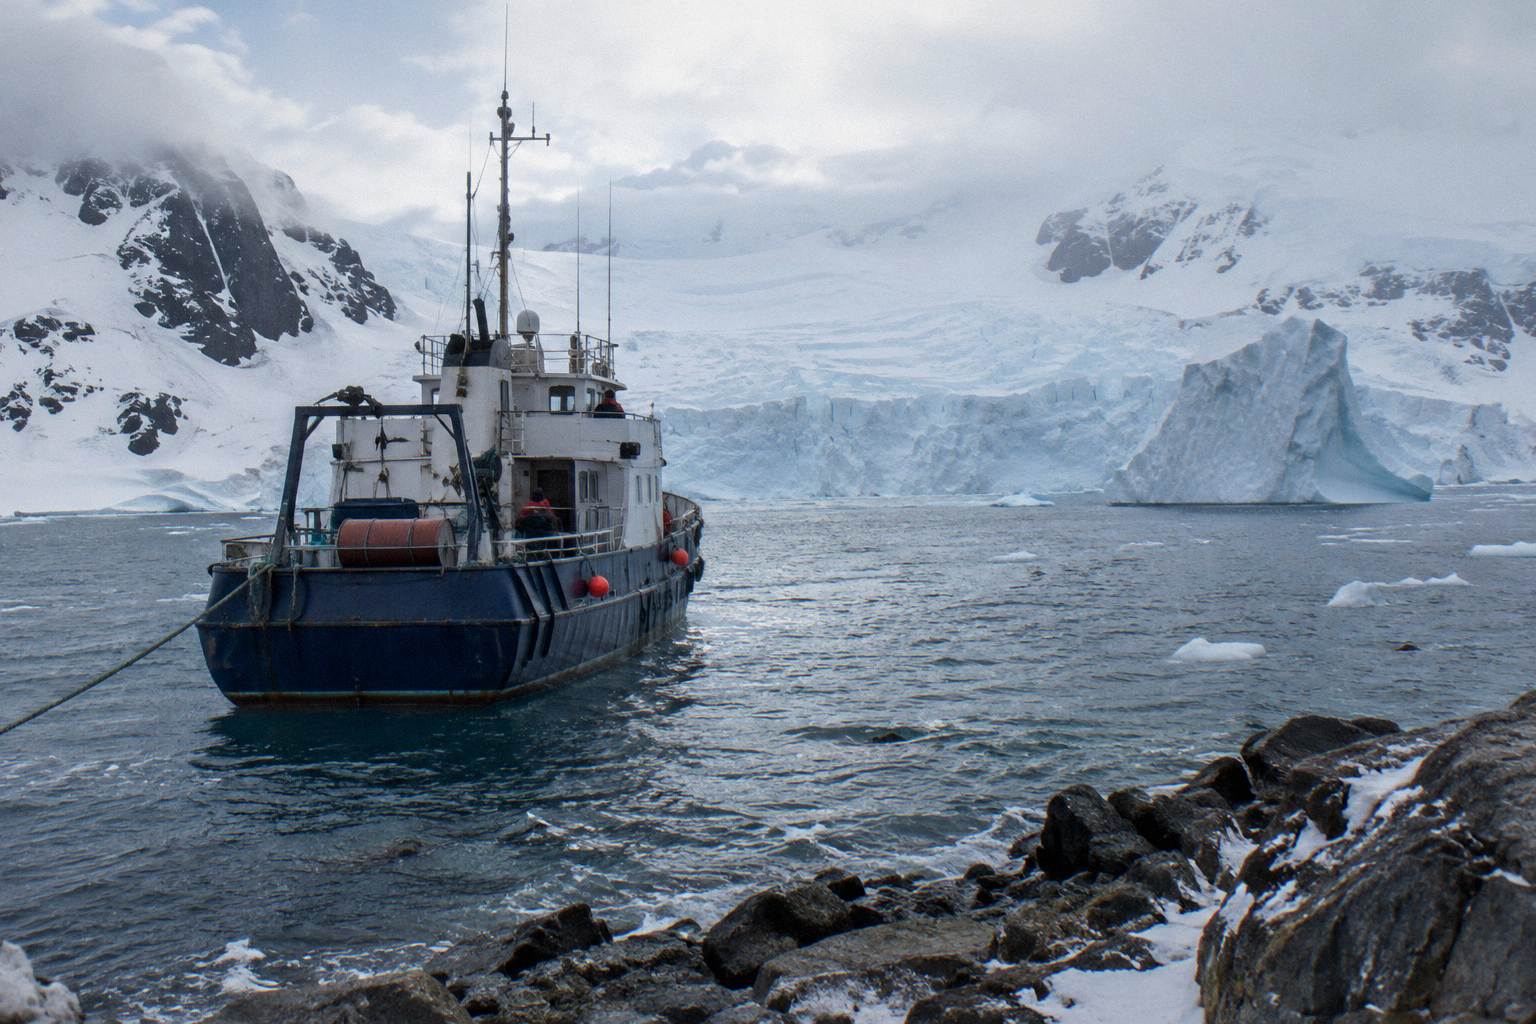 Cruise CancellationsOperator and passenger cancellation terms for Antarctic voyages, with real storm examples and four operators' penalty schedules.Read the guide
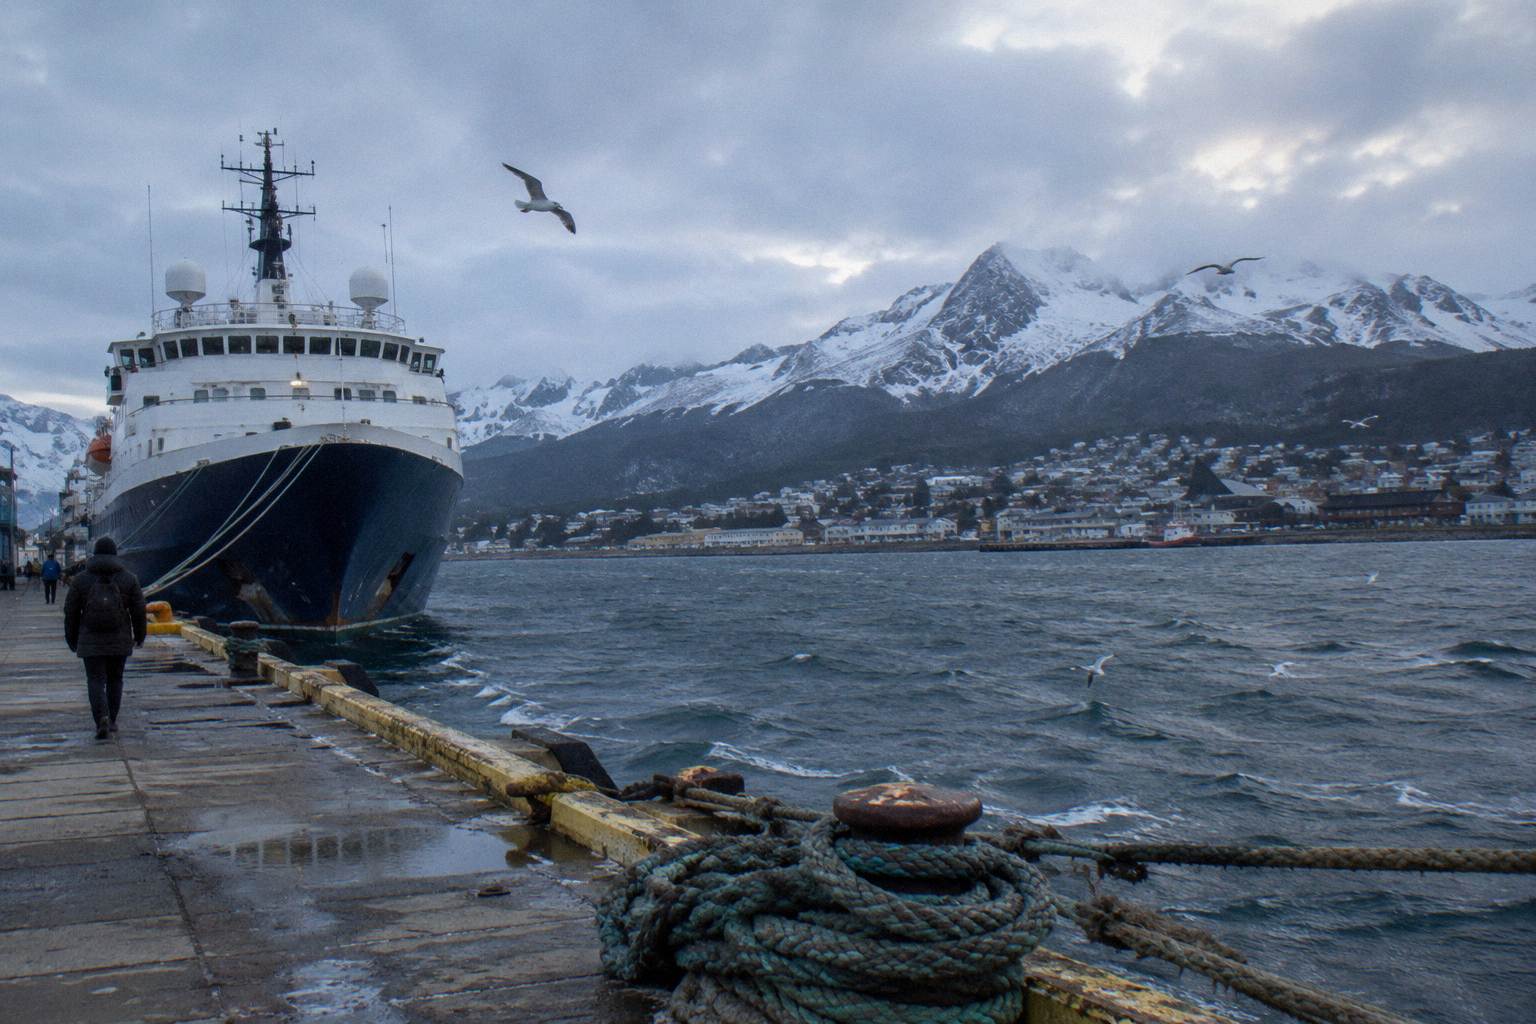 Deposits And PaymentsDeposit sizes, final payment deadlines and cancellation penalties for Antarctica cruises, operator by operator.Read the guide
 Is It SafeThe Polar Code, the 2022 incidents, evacuation routes and insurance minimums, stated plainly.Read the guide